BitForged Space
  • Communities
  • Create Post
  • Create Community
  • heart
    Support Lemmy
  • search
    Search
  • Login
  • Sign Up
Sunshine (she/her)@lemmy.ca to Data is Beautiful@mander.xyzEnglish · 1 year ago

Average strength of polarization by type and country

lemmy.ca

message-square
17
link
fedilink
25

Average strength of polarization by type and country

lemmy.ca

Sunshine (she/her)@lemmy.ca to Data is Beautiful@mander.xyzEnglish · 1 year ago
message-square
17
link
fedilink
alert-triangle
You must log in or register to comment.
  • OutForARip@lemmy.ca
    link
    fedilink
    English
    arrow-up
    12
    ·
    1 year ago

    What does this mean?

    • Beryl@jlai.lu
      link
      fedilink
      English
      arrow-up
      6
      ·
      edit-2
      1 year ago

      Yeah, in what scale is polarisation measured? How are identity or idea-based polarisation defined? Also, what’s up with the awful kerning?

    • TropicalDingdong@lemmy.world
      link
      fedilink
      English
      arrow-up
      6
      arrow-down
      1
      ·
      1 year ago

      This should be a scatter plot.

    • Suzune@ani.social
      link
      fedilink
      English
      arrow-up
      4
      ·
      1 year ago

      Here is a usable link: https://www.tandfonline.com/doi/full/10.1080/13510347.2022.2117300

  • mumblerfish@lemmy.world
    link
    fedilink
    English
    arrow-up
    12
    ·
    1 year ago

    Link https://www.tandfonline.com/doi/full/10.1080/13510347.2022.2117300#abstract

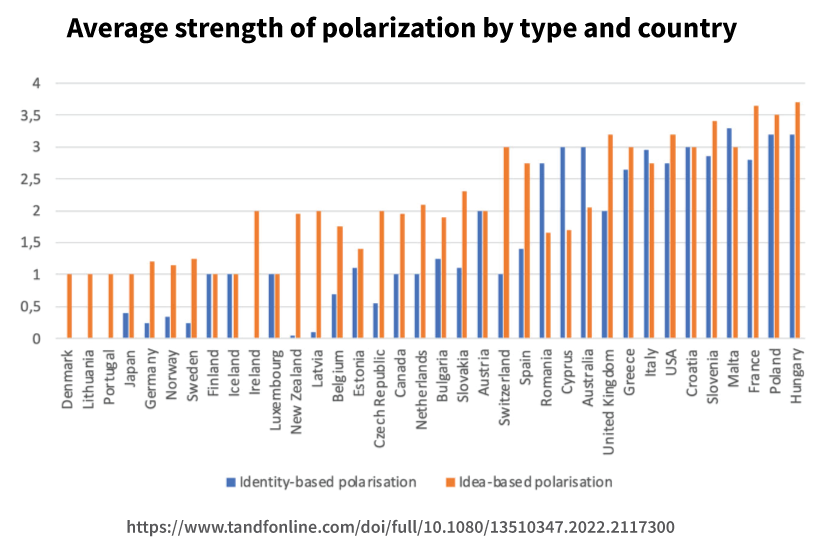
    Definition of concepts from abstract:

    Political views, opinions, and worldviews become increasingly irreconcilable (idea-based polarization), while at the same time society appears to be getting fractured in antagonistic, opposing camps (identity-based polarization).

    I’m not sure how it is actually measured. It is from the v-dem dataset. Is that questionaire data?

    • Blaze (he/him)@sopuli.xyz
      link
      fedilink
      English
      arrow-up
      4
      ·
      1 year ago

      Thanks for the link

  • TropicalDingdong@lemmy.world
    link
    fedilink
    English
    arrow-up
    8
    arrow-down
    1
    ·
    1 year ago

    God if only there were a way to plot x by y on two independent axis…

    • SwordInStone@lemmy.world
      link
      fedilink
      English
      arrow-up
      7
      arrow-down
      1
      ·
      1 year ago

      axes

    • Aatube@kbin.melroy.org
      link
      fedilink
      arrow-up
      1
      ·
      11 months ago

      Well I don’t see how you would be able to tell which dot belongs to which country. I would like a scatter plot, but it appears the authors want to tell a different story

  • Match!!@pawb.social
    link
    fedilink
    English
    arrow-up
    6
    ·
    1 year ago

    could we install a turbine and use this to generate power

    • Noodle07@lemmy.world
      link
      fedilink
      English
      arrow-up
      2
      ·
      1 year ago

      If populist propaganda could generate power we’d be fossil fuel free by next week

  • HottieAutie@lemmy.dbzer0.com
    link
    fedilink
    English
    arrow-up
    5
    ·
    1 year ago

    I see USA, Hungary, and Poland up there pretty high. I wonder if Russia has anything to do with that.

    • HootinNHollerin@lemmy.world
      link
      fedilink
      English
      arrow-up
      3
      ·
      1 year ago

      Definitely

  • Monkey With A Shell@lemmy.socdojo.com
    link
    fedilink
    English
    arrow-up
    1
    ·
    1 year ago

    I’m curious the method here. The USA I would guess at being 90%+ firmly one or the other with a handful of squishy between, but how do they measure the level of it… 🤔

  • Kaboom@reddthat.comBanned
    link
    fedilink
    English
    arrow-up
    5
    arrow-down
    6
    ·
    1 year ago

    How does one read this chart?

    • themeatbridge@lemmy.world
      link
      fedilink
      English
      arrow-up
      7
      ·
      1 year ago

      Just go to the link, which is a long string of numbers displayed as text in an image so as to be as cumbersome as possible.

    • TropicalDingdong@lemmy.world
      link
      fedilink
      English
      arrow-up
      3
      arrow-down
      1
      ·
      1 year ago

      by downloading the data and turning it into a scatter plot

Data is Beautiful@mander.xyz

dataisbeautiful@mander.xyz

Subscribe from Remote Instance

Create a post
You are not logged in. However you can subscribe from another Fediverse account, for example Lemmy or Mastodon. To do this, paste the following into the search field of your instance: !dataisbeautiful@mander.xyz

Be respectful

Visibility: Public
globe

This community can be federated to other instances and be posted/commented in by their users.

  • 176 users / day
  • 273 users / week
  • 1.4K users / month
  • 3.64K users / 6 months
  • 1 local subscriber
  • 2.72K subscribers
  • 212 Posts
  • 3.6K Comments
  • Modlog
  • mods:
  • KnowledgeIsPower@mander.xyz
  • Beaver@lemmy.ca
  • WanderingPhoenix@mander.xyz
  • BE: 0.19.11
  • Modlog
  • Instances
  • Docs
  • Code
  • join-lemmy.org